
Anyone interested in tech stocks would likely be familiar with the NASDAQ, which has long been regarded as the main benchmark for the technology sector.
Interestingly, the NASDAQ (officially known as the NASDAQ 100) was not set up specifically to track the technology stock market. The index draws from several sectors including consumer staples, healthcare and utilities.
Investors, fund managers and analysts rely on the performance of the index to understand the performance of the technology and innovation sectors of the global economy, and make investment decisions based on the data.
Key Points
- The NASDAQ 100 index serves as a key benchmark for the technology sector, comprising the 100 largest non-financial companies from various sectors and is periodically reviewed for balance.
- Trading the NASDAQ via CFDs allows for speculative opportunities on price movements without owning the underlying assets, offering leverage and the ability to take both long and short positions.
- Proper risk management, including setting trade sizes, using stop-loss and take-profit points, and cautious leverage use, is crucial for trading the NASDAQ Index effectively.
What is the NASDAQ 100?
The NASDAQ 100 is the prime benchmark of the NASDAQ stock exchange, located in the United States. It tracks the 100 largest companies listed on the stock exchange, with constituents drawn from eight different sectors in total.
Notably, the NASDAQ index does not include financial companies and banks. This is in line with its stated purpose to track the largest and most innovative non-financial companies in the world.
The index employs a modified capitalisation method, which uses the individual weights of included items according to their market capitalisation. This helps to prevent the largest companies from having outsized influence over the index, and promotes better balance among all constituents.
The NASDAQ is reviewed every quarter, and adjustments are carried out when necessary to maintain the index’s distribution standards. In July 2023, the NASDAQ underwent a special rebalancing when its largest constituents by market-cap experienced a surge in prices, causing the index to be too top-heavy and unbalanced.
What Companies are in the NASDAQ 100?
Top 10 constituents of the NASDAQ 100 Index [1]
At the time of writing, the top 10 constituents of the NASDAQ are as follows:
| Company | Weight (%) |
| Microsoft Corp. | 8.67 |
| Apple Inc | 7.96 |
| NVIDIA Corp | 6.32 |
| Amazon Inc | 5.48 |
| Meta Platforms Inc | 4.69 |
| Broadcom Inc | 4.49 |
| Alphabet Inc (GOOGL) | 2.80 |
| Alphabet Inc (GOOG) | 2.72 |
| Costco Wholesale Inc | 2.54 |
| Tesla Inc | 2.29 |
Trading hours of the NASDAQ 100 Index [2]
The NASDAQ follows the trading hours of the New York Stock Exchange.
- Mondays to Fridays
- 9.30 am to 4 pm
- Extended trading hours
- Pre-market: 4:00 am to 9:30 am
- After hours: 4:00 pm to 8:00 pm
The exchange is closed on Saturdays and Sundays, as well as nine national holidays, as follows:
- New Year’s Day
- Martin Luther King, Jr. Day
- Presidents’ Day
- Good Friday
- Memorial Day
- Independence Day
- Labor Day
- Thanksgiving Day
- Christmas Day
Why the NASDAQ Came to be Known as the Leading Tech Sector Benchmark
A look at the top constituents of the NASDAQ tells us the answer.
Out of the total weightage of the sectors, it can be seen that the technology sector makes up 57.1% of the index [3]. This consists of some of the largest technology companies in the world such as Apple, Microsoft, Nvidia, Alphabet and Tesla.
Given these factors, it’s only logical that the NASDAQ quickly became the prime benchmark for the technology sector on the whole.
Why trade the NASDAQ Index? [4,5]
With the top technology companies of the world making up over 45% of the index, the NASDAQ is both a competent barometer and convincing representation of the technology sector.
Importantly, the NASDAQ isn’t just about tech stocks. The index tracks companies that are leaders in technology and innovation, and includes several established companies and owners of household names that are pushing the envelope with technological advances and innovative practices.
This curated area of focus has proven its merits many times over. Over the first three quarters of 2023, the NASDAQ outperformed the S&P 500 by a substantial margin of 22.3%. This was attributed to the recovery of the technology and growth-related stocks within the index.
Thus, investing in the NASDAQ allows investors to access the fast-moving tech and innovation sector through the lens of the most successful companies in history. Investors can also include NASDAQ in a tech portfolio to diversify risk and counterbalance against more speculative plays such as technology startups.
Historical trends of the NASDAQ Index [6,7,8]
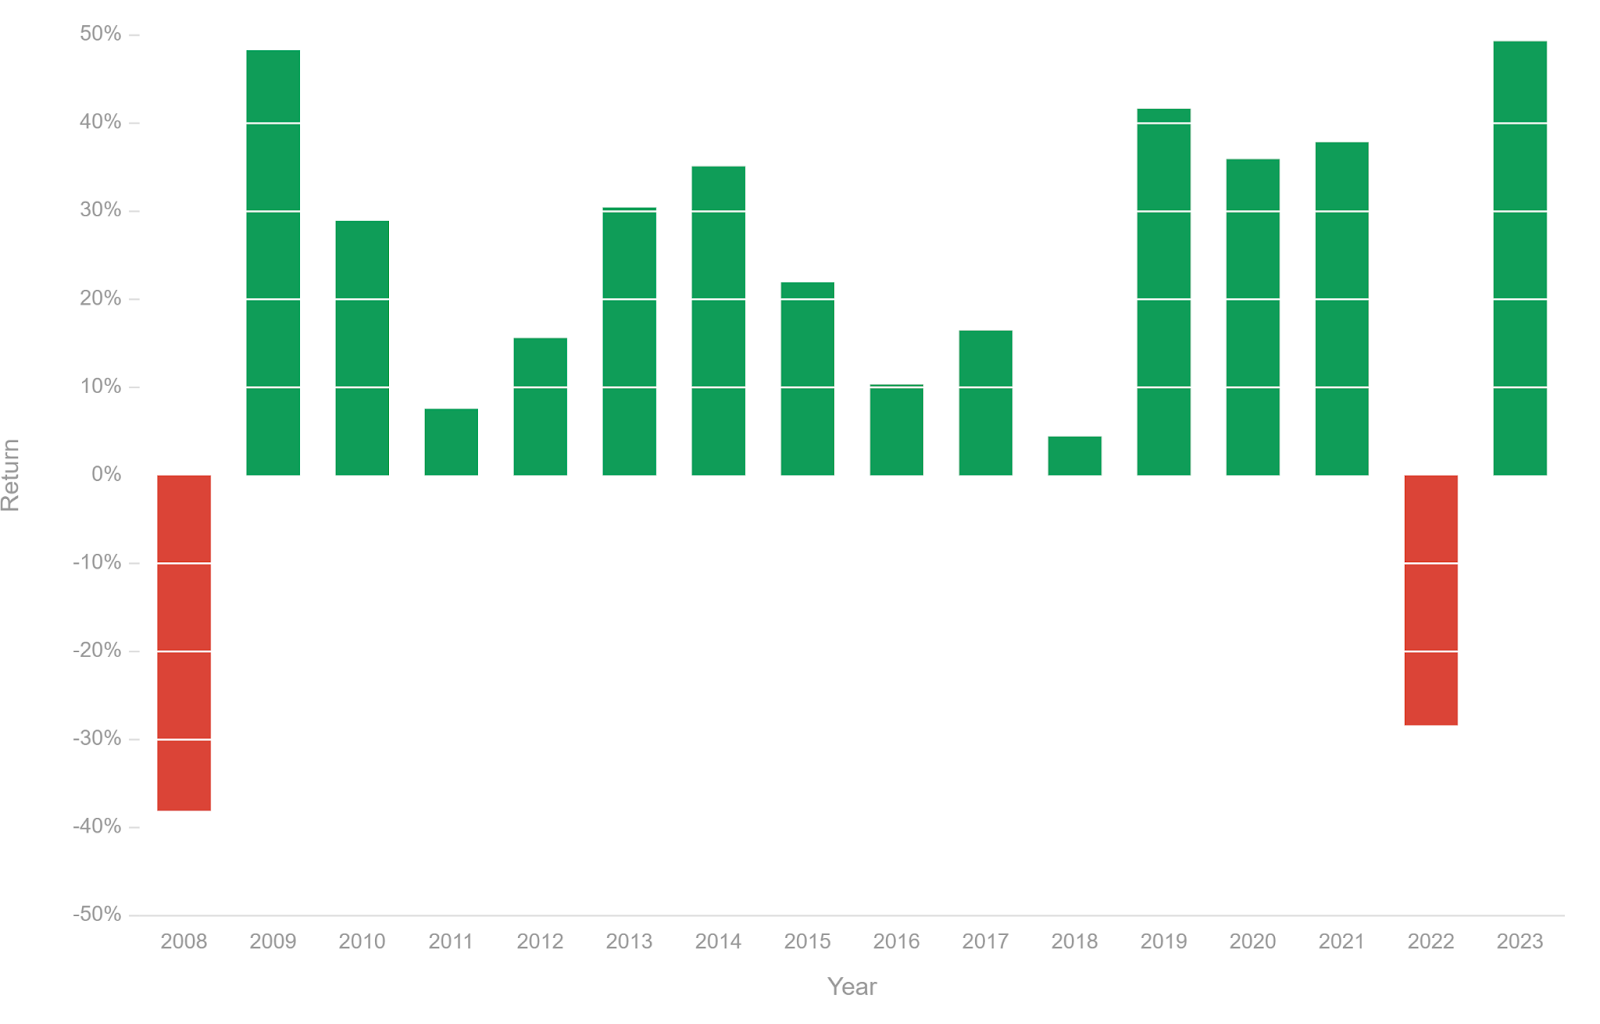
The chart above shows the yearly returns of the NASDAQ Index from 2008 to 2023. During this period, the index’s return was negative in only two years, while managing to end positive in most of the other years.
Prior to 2008, the NASDAQ experienced heavy losses during and in the aftermath of the 2000 dot.com bubble, falling by 36.1% in 2000, 33.3% in 2001, and 32.6% in 2022. In 2003, the index had rallied, ending the year up by nearly 50%.
A similar trend can be seen after the 2008 crash, which was immediately followed by one of the NASDAQ’s best years in recent memory. And then in 2023, the index mounted another major bounceback after the 2022 pandemic crash.
It should be noted that the NASDAQ shows a high degree of volatility, with gains as much as 50% as well as losses of almost 40%. This is to be expected, given the comparatively narrower focus of the index.
Zooming out a little further reveals that the NASDAQ is capable of consistently outperforming other major market indices. Here’s how the NASDAQ performed across three 10-year periods, compared to the S&P 500 and the Russell 2000.
| Time period | NASDAQ | S&P 500 | Russell 2000 |
| 1991 – 1999 | 1749% | 442% | 337% |
| 2000 – 2011 | -36% | 7% | 72% |
| 2012 – 2023 | 733% | 371% | 215% |
How to trade the NASDAQ Index with CFD
Investors looking to capitalise on the volatile price movements of global tech stocks can do so by trading the NASDAQ using Vantage CFDs (Contracts-for-Difference).
CFDs allow speculation of the price movement of the index without direct ownership of fund units or stocks of the companies represented in the NASDAQ. Direct investment in the index is not possible, as it is simply a benchmark tracking a basket of company stocks.
Here’s a simple explanation of how trading the NASDAQ using CFDs works: You open a trade by choosing whether the index will go up or down. If the price goes with your position, you make a profit. If it goes against your position, you will incur a loss.
At the close of the contract, the difference in the price of the index is settled directly in your account.
Why trade NASDAQ Index with CFDs?
One advantage of CFDs is that you can make trades on leverage, which will increase your gains if the trade goes in your favour. However, using leverage will also increase your losses if the trade goes against you. Hence, leverage should be used with caution.
Also, CFDs allow you to take both long and short positions. This means that you don’t have to wait for the index to rise in order to make a profit. You can also take a short position to profit when the index falls.
Lastly, CFDs have a comparatively lower barrier to entry. You can start trading the NASDAQ with lesser capital, compared to buying shares of a NASDAQ index fund.
Analysing the NASDAQ Index market
Fundamental analysis
The NASDAQ is the leading benchmark for the global technology and innovation sector, and there are nuances to understand beyond just leading tech stocks such as FAANG or the Magnificent Seven (Apple, Microsoft, Amazon, Alphabet, Facebook, Netflix, and Tesla).
As such, analysing the NASDAQ entails developing a keen understanding of technology and innovation. Investors would do well to also study how consumer trends and preferences influence – and are shaped by – tech as it increasingly encroaches on everyday life.
Here are some key pointers when applying fundamental analysis to the NASDAQ Index.
- Economic data
- Economic data such as GDP, interest rates and inflation levels are important signallers of the American economy, and can impact major US indices, including the NASDAQ Index. One of the most anticipated events is whether the US Federal Reserve will carry out any interest rate cuts in 2024.
- Lowering interest rates could prove to be a double-edged sword. With continued high global inflation, a premature rate cut may keep prices high for longer. On the other hand lowering interest rates could extend the current market rally and push the NASDAQ to even greater heights.
- Corporate earnings
- As the NASDAQ tracks some of the largest companies in the world, it is crucial to include corporate earnings in your analysis. Thankfully, news and media outlets heavily report on top tech companies like Apple and Google, making keeping track of corporate earnings a relatively easy task for the NASDAQ investor. It may also be worthwhile seeking out the opinions and predictions of analysts to better prepare for potential outcomes.
- Industry trends
- Given the tight intertwine between tech and modern lifestyles, investors should expect consumer trends to have an impact on the NASDAQ. This is especially so considering that non-tech companies that put forth welcome innovations can also shift consumer preference and spark off demand in unexpected ways.
- As such NASDAQ investors should pay attention to consumer patterns and upcoming trends that could point to potential opportunities.
Technical analysis
To perform technical analysis for the NASDAQ, you would require a price chart, charting tools and the knowledge of how to read them
Here are two easy-to-read technical indicators to help you interpret the NASDAQ price action.
- Percentage Price Oscillator (PPO)
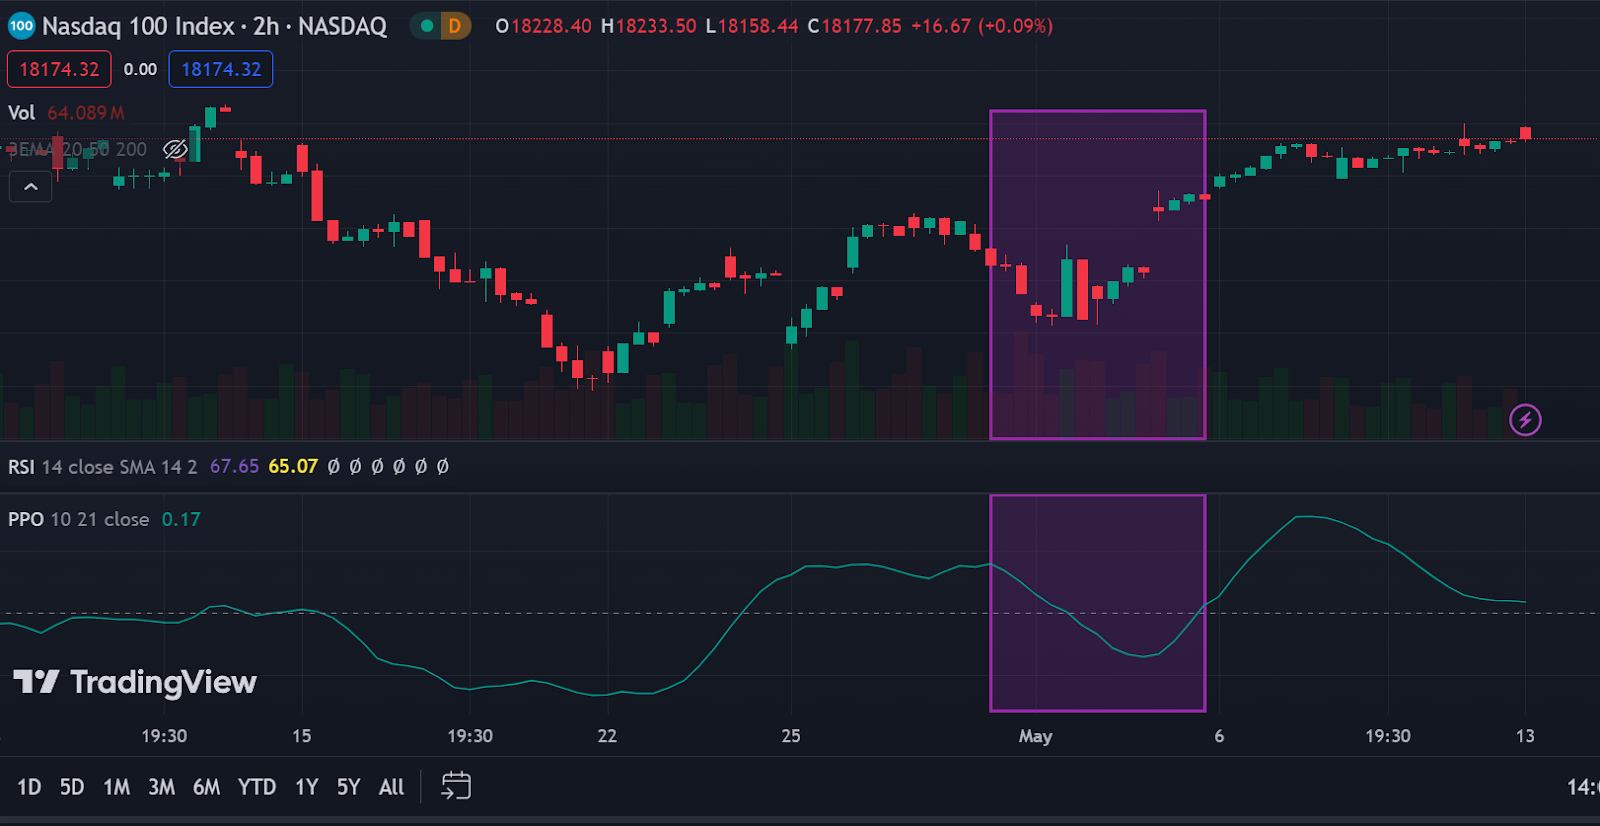
The screenshot above shows a price chart for the NASDAQ Index in the top part. In the bottom section, the Percentage Price Oscillator (PPO is shown).
In simple terms, the PPO is a technical indicator that can indicate market momentum in the NASDAQ. It is read using the green squiggly line and the grey straight line. When the green line is above the grey line, it indicates market momentum is climbing. When the green line is below the grey line, it means market momentum is falling.
PPO can reveal trends where price candles cannot. For example, take a look at the purple-shaded areas. The sudden appearance of a large green candle may point to the beginning of a market rally. However, the PPO then was in a downward slope, indicating decreasing market momentum. This was proven to be true when an even larger red candle formed, wiping out previous gains.
- Lines of Support and Resistance
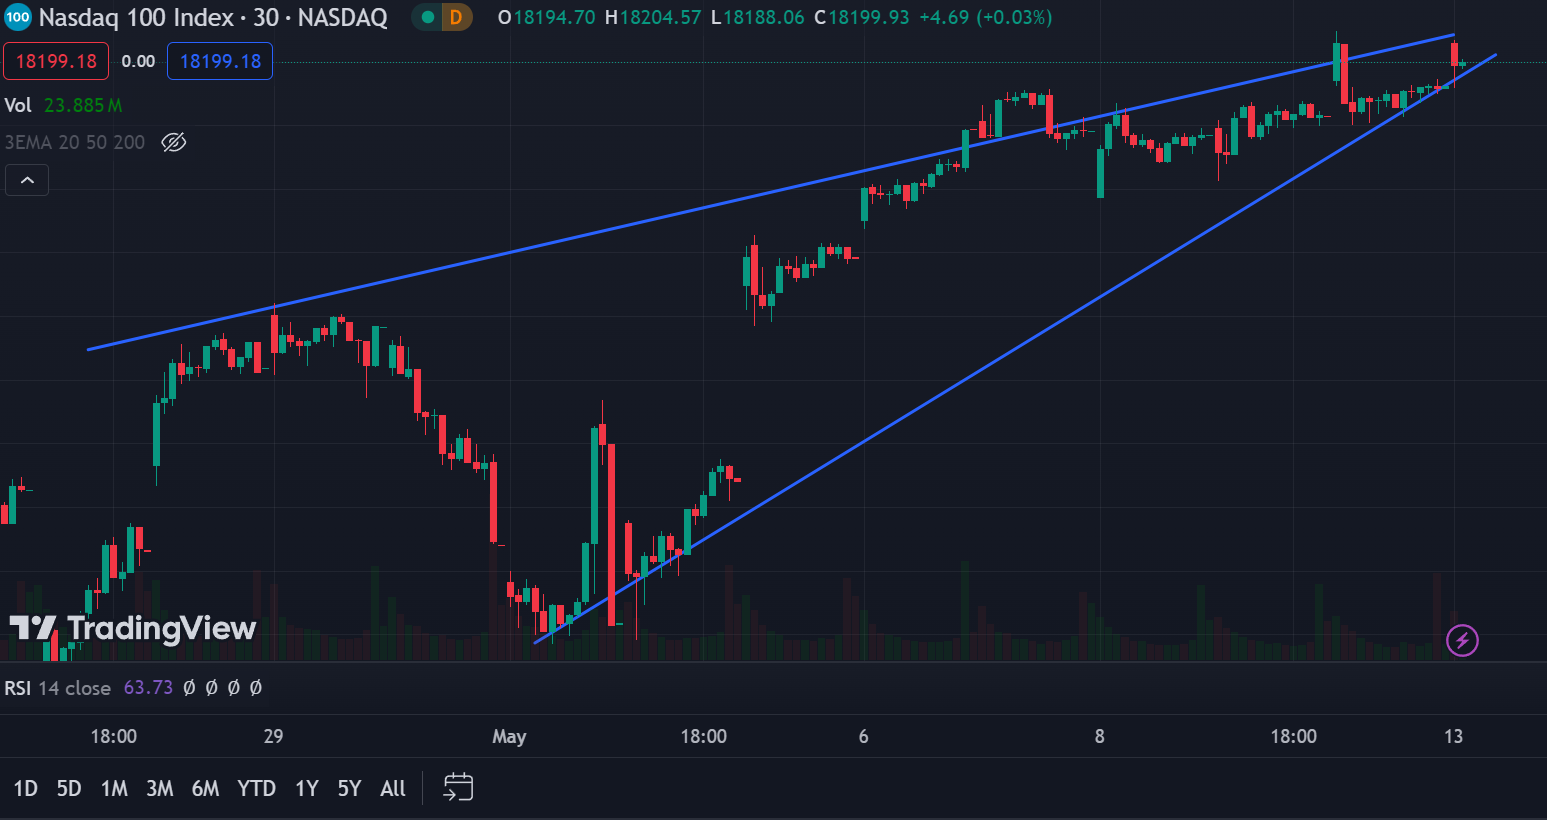
In the screenshot above, we see the price chart for the NASDAQ spanning the past two weeks.
The blue line at the bottom charts a Line of Support, whereas the blue line at the top charts a Line of Resistance.
In brief, a Line of Support shows the lowest point where prices can potentially fall back towards in a given range. It is drawn by connecting as many of the lowest points in a price chart as possible.
Conversely, a Line of Resistance shows the highest point where prices have reached in a given range. It is drawn by connecting as many of the highest points in a price chart as possible.
Lines of Support and Resistance can be used to identify trends and spot incoming changes. For instance, we can clearly see that the NASDAQ has been charting an upward trend in the past two weeks.
However, the more important question is whether the trend will continue.
Incidentally, our chart here shows that the NASDAQ is likely headed for a downtrend soon, due to the rising wedge pattern formed by both lines. You can see that the bottom line is steeper than the line on top – this indicates that the lows are catching up to the highs, which may bring about a price reversal in short order [9].
You can consult our other guides for detailed explanations on technical indicators and technical analysis. It’s crucial to understand that these are merely tools that help us form an informed opinion on the state of the market. No indicator is 100% accurate, nor is there any that can predict which way the index will go.
Trading strategies for the NASDAQ 100
When trading the NASDAQ 100, investors can choose from a variety of trading strategies, whether short, medium or long term.
Short-term trading strategies
Day trading
Day trading the NASDAQ focuses on short-term trades that typically do not last longer than a day, and trades may even be as short as a few hours. In day trading, no positions are kept open overnight to head off risk from unexpected news and events.
Day traders aim to achieve multiple winning trades throughout the day, stacking up returns over several wins. This strategy requires discipline and the ability to make fast decisions, capitalising on opportunities when they present themselves, while not overtrading or exceeding risk limits.
News trading
News trading as a trading strategy offers a more relaxed, ad hoc approach when investing in the NASDAQ. The idea is to look out for news, trends and developments and evaluate each for potential trading opportunities.
As mentioned earlier, corporate earnings are important to the NASDAQ, so news traders should be sure to keep up with earnings reports and other important economic announcements. An economic calendar can prove useful for this purpose.
Mid-term trading strategies
Swing trading
Swing trading is a popular trading strategy that aims to capture potential returns when a swing in the price of the NASDAQ is spotted.
When the price changes direction from up to down, or down to up, a swing is said to have occurred. The challenge in swing trading is accurately identifying upcoming swings and then placing appropriate trades to capitalise on them.
Swing trades can be made on small swings that happen throughout the trading day, or on larger swings that span a longer time period.
Depending on which you choose, price swings could last a long while, which means swing traders would need to keep their trades open to capture as much profit as possible until the swing runs its course. This may mean holding trades overnight, which comes with the risk of volatility from unexpected or sudden events.
A typical swing trade lasts anywhere from two days to several weeks, depending on the volatility of the market, and how big of a swing the trader wants to capture. As such, swing trading is a suitable strategy for those who prefer medium-term strategies.
Long-term trading strategies
Long term trading strategies can also pay off well when trading the NASDAQ. Such strategies may last up to and beyond several months or years.
Given NASDAQ’s tendency towards a high-growth, high-volatility index, a good way to blunt the effects of wild price swings is with a buy-and-hold strategy. Over the long run, investors may reap more optimal returns compared to other strategies.
Investors with a strong conviction in the long-term trend of the NASDAQ should note that they cannot own the index directly. Instead, you can invest in the NASDAQ via index ETFs, including:
- Invesco Nasdaq 100 ETF (QQQM)
- Invesco QQQ (QQQ)
- iShares Nasdaq 100 UCITS ETF (ACC)
When choosing a NASDAQ-tracking ETF, pay attention to the expense ratio, which is the fee charged by the fund managers. Generally, ETFS have low expense ratios, but will still impact your returns, especially over the long term.
Risk management strategies when trading NASDAQ Index [10]
While the NASDAQ is a highly popular and important market index, proper risk management should still be practised during trading. Be sure to heed these tips and recommendations.
Set proper trade sizes
The size of each trade should be limited to under 2% of your total capital to prevent your account from taking substantial losses from a few bad trades. This is instrumental in preventing your investment capital from being abruptly wiped out.
Make use of stop-loss and take-profit
Proper use of stop-losses and take-profits can help you prevent overtrading, or holding on to a trade longer than you should.
Set a stop-loss point to cut your losses and preserve your remaining capital for the next trade. One suitable point to set a stop-loss is when the index falls below a key support level.
Meanwhile, use a take-profit point to avoid losing profit due to greed. A winning trade may tempt you to keep the trade open in the hopes of capturing more profit. But in doing so, you’ll risk having the price move against you and wipe out your gains.
For instance, watch out for when the index approaches a key resistance level after a large move upwards. This may be a good time to sell and take profit, before consolidation takes place.
Use leverage with caution
Leverage can be a powerful ally, but it could also be your worst enemy. Remember that while leverage magnifies your gains from a winning trade, any losses will also be increased by the same degree. This can result in losses that exceed your capital, putting your account in the negative.
Have a trading plan in place
Above all, understand that trading requires a highly disciplined approach. Trading should be approached with discipline and logic, and the lack of clear guidelines is likely to lead to failure.
Formulate a detailed trading plan that spells out your goals and objectives, strategies you will use, appetite for risk, and your maximum budget available for trading each week or month.
These factors will form the basis of your trading plan, helping you to develop the discipline and habits required for long term success.
Conclusion: Trade the NASDAQ with Vantage via CFDs
Trade the NASDAQ 100 with Vantage CFDs to potentially benefit from global tech leaders without direct ownership of underlying fund units or company shares. Benefit from tight spreads and low cost – starting from $0 per trade.
Explore opportunities to generate potential returns across diverse market conditions, with the choice to open long or short positions, and control risk with tools such as negative balance protection, price alerts and stop losses. With real time new alerts on our mobile app and trading platform, you get the power and flexibility to react quickly to market developments, and trade on the go.
Sign up for a live account and experience the Vantage advantage today.
References
- “Nasdaq 100 Companies – Slickcharts”. https://www.slickcharts.com/nasdaq100. Accessed 17 May 2024.
- “Trading Hours for the Nasdaq Stock Markets – Nasdaq”. https://www.nasdaq.com/stock-market-trading-hours-for-nasdaq. Accessed 17 May 2024.
- “Nasdaq 100 Index: What It Is, How It’s Weighted and Traded – Investopedia”. https://www.investopedia.com/terms/n/nasdaq100.asp. Accessed 17 May 2024.
- “The Nasdaq-100: Where technology isn’t just in the tech sector – Invesco QQQ”. https://www.invesco.com/qqq-etf/en/etf-insights/the-nasdaq-100-where-technology-isnt-just-in-the-tech-sector.html. Accessed 17 May 2024.
- “When Performance Matters: Nasdaq-100® vs. S&P 500 – Nasdaq”. https://www.nasdaq.com/reports/q3-2023-ndx-performance. Accessed 17 May 2024.
- “Historical performance of the Nasdaq-100 index – Curvo”. https://curvo.eu/backtest/en/market-index/nasdaq-100?currency=usd. Accessed 17 May 2024.
- “Historical Average Returns for Nasdaq 100 Index (QQQ) – Trade That Swing”. https://tradethatswing.com/historical-average-returns-for-nasdaq-100-index-qqq/. Accessed 17 May 2024.
- “A Short History of Nasdaq 100 Returns – A Wealth Of Common Sense”. https://awealthofcommonsense.com/2023/12/a-short-history-of-returns-for-the-nasdaq-100/. Accessed 17 May 2024.
- “How To Recognize And Trade Rising Wedge Patterns – Investopedia”. https://www.investopedia.com/articles/trading/07/rising_wedge.asp. Accessed 17 May 2024.
- “Risk Management Techniques for Active Traders – Investopedia”. https://www.investopedia.com/articles/trading/09/risk-management.asp. Accessed 17 May 2024.


